This page introduces the typical application of Multiple Linear Regression and how to report the findings.
A brief introduction to the study:
To improve enrollment quality of new students at a university, a researcher was interested to identify the best predictors of students' GPA at the end of first year. The researcher had collected a wide range of demographic, psycho-social and cognitive variables from each student. Multiple linear regression analyses were conducted to investigate specific research interests: 1) How well could ACT scores and high school class ranks predict first year students' GPA? 2) What variables were the best predictors of GPA at the end of first grade? 3). If ACT was a good predictor of GPA, did girls have a different prediction than boys? Similarly, was gender a moderator between GPA and ACT? 4) Whether a student from a public or a private high school moderated the relation between ACT and GPA?
Since a missing value on any independent variable would exclude the entire case from the regression analysis, the researcher list-wise deleted the students with any missing scores. The final analyses were based on a sample of 564 students. To illustrate how to report findings from a multiple linear regression, only related variables were selected in the SPSS dataset.
Results:
Multiple linear regression was conducted using GPA as the dependent variable and ACT scores, school ranks at high school, gender, and whether the student was from a public or private high school as the independent variables (the predictors). SPSS version 13.0 was used to perform the regression analyses and produce residual plots for diagnostic purposes.
Multiple linear regression was very sensitive to outliers, therefore, both univariate and multivariate outliers were carefully examined. The criterion for a univaraite outlier was defined as any z-score great than 3 or less than -3. The Cooks distance test with p < 0.01 was used as the criterion for a multivariate outlier. Using the above criteria, ten cases were identified as outliers and were excluded from the multiple regression analysis.
Normality assumption was examined using the consensus that any skewness index grater than 1 or less than -1 was an indication of non-normal distribution. None of the skewness index was out of the range for all variables in the model, although Rank has a skewness index = - 0.935 indicating a tendency of negative distribution.
Table 1 presents the correlation, means and standard deviations for the dependent variable (GPA) and the four independent variables. It can be seen from Table 1 that GPA was strongly correlated with ACT scores and with high school class ranks. But GPA was weakly but significantly correlated to whether the student was from a public or private school. Among the independent variables, ACT was positively correlated with class ranks in high schools showing that students with higher ranks in class tent to have higher ACT scores.
Table 1
Correlations, Means and Standard Deviations for GPA and the Predictors
| 1 | 2 | 3 | 4 | 5 | |
| 1 Rank | 1.00 | ||||
| 2 ACT | .43** | 1.0 | |||
| 3 Sex | .06 | -.02 | 1.0 | ||
| 4 School | .00 | -.06 | .43** | 1.0 | |
| 5 GPA | .39** | .33** | -.04 | -.10* | 1.00 |
| Mean | 77.22 | 24.57 | .49 | .77 | 2.98 |
| std | 17.67 | 3.87 | .50 | .42 | .62 |
Table 2 presents the findings from the multiple linear regression. We can see from Table 2 that ACT, Rank and School were significant predictors of GPA with p < 0.05. We used unstandardized estimates for interpretation of the findings. For example, the unstandardized estimate of ACT is 0.03 indicating that an increase in one score in ACT was related to an increase of 0.03 point in GPA at the end of first year, holding other variables constant.
R-Square is an index to the percentage of variance in the dependent variable explained by the predictors. From this multiple regression, the R-Square = 0.189, indicating that approximately 19% of students' GPA could be accounted for by the four predictors in the regression model.
Table 2
Results from Multiple Regression Model Predicting GPA
| B | Beta | t | p | |
| Intercept | 1.51 | 9.08 | 0.000 | |
| High School Class Rank | 0.01 | 0.30 | 7.13 | 0.000 |
| ACT Scores | 0.03 | 0.19 | 4.51 | 0.000 |
| Gender | -0.02 | -0.02 | -0.33 | 0.740 |
| School | -0.12 | -0.08 | -1.98 | 0.049 |
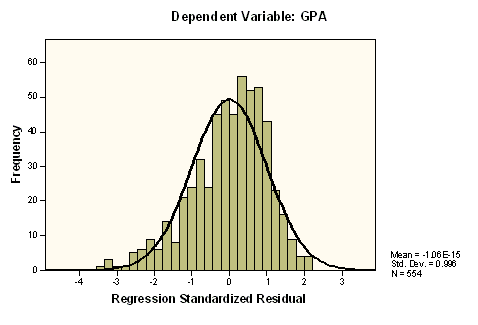
Figure 1 presents a histogram of standardized residuals from the multiple regression analysis. We can see that the residuals are approximately normal indicating the satisfaction of the normality assumption.
Figure 1
Histogram of Standardized Residuals from Multiple Linear Regression

|
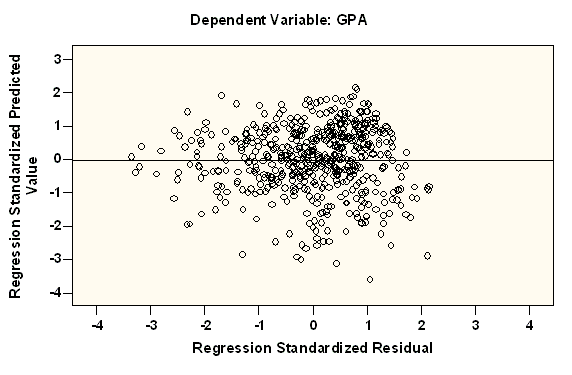
Figure 2 presents a scatter plot of standardized residuals and predicted values. Figure 2 shows that dots are approximately equally distributed above and below the horizontal zero line without a particular pattern, indicating independence of the residuals.
Figure 2
Residual Plot against Standardized Predicted Values

|
To examine whether gender is a moderator variable for the prediction of GPA, two product terms, gender × ACT and gender × Rank, were entered simultaneously with the main effects in the multiple regression model. Table 3 presents the results from the multiple regression for examining the moderating effects. It can be seen from Table 3 that none of the product terms were significant, indicating that the relationship between GPA and ACT scores were not different between male and female students.
Table 3
Results from Multiple Regression Model for Examining Gender as a Moderator
| B | Beta | t | p | |
| Intercept | 1.54 | 6.84 | 0.000 | |
| High School Class Rank | 0.01 | 0.26 | 4.58 | 0.000 |
| ACT Scores | 0.03 | 0.21 | 3.60 | 0.000 |
| Gender | -0.08 | -0.07 | -0.26 | 0.799 |
| School | -0.13 | -0.09 | -2.00 | 0.047 |
| Gender x ACT | -0.01 | -0.14 | -0.52 | 0.604 |
| Gender x Rank | 0.00 | 0.20 | 1.03 | 0.305 |
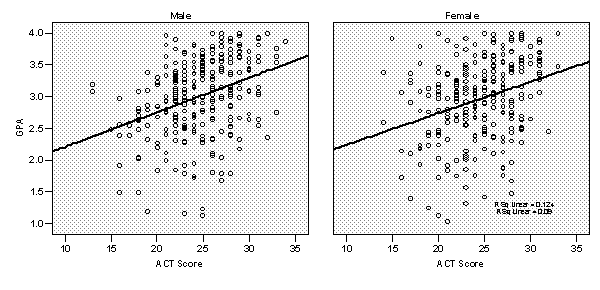
Figure 3 presents the scatter plots and the regression lines for comparing male and female students in terms of the association between ACT and GPA. The two regression lines were almost parallel, showing no interaction of gender and ACT in the prediction of GPA. Similar analysis was conducted for the variable School. School was not found as a significant moderator, suggesting that the relation between ACT and GPA was not different for students from public or private high schools.
Figure 3
Regression Lines predicting GPA with ACT Scores for Males and Females Separately

|
To download the source data, please click here.