
This page introduces the typical application of ANCOVA and how to report the findings.
A brief introduction to the study:
A school-based intervention program was designed to promote adolescent social competence skills in middle schools. Randomization was based on schools with participants (N = 925) in 3 middle schools selected as the treatment group and participants (N = 1075) in other 3 middles schools as the control group. All 6 schools were located in the same school district with a majority of residents as middle class families.
Social competence was a composite score consisting of problem solving abilities, communication skills and efficiency of using time. Questionnaires were administered at the beginning of 6th grade prior to the intervention program and again at the end of 8th grade. Parent involvement in adolescent academic program was also reported by participants at the beginning of 6th grade. The interest of the study was to evaluate the intervention effect at the 8th grade with adjustment to social competence and parent involvement measured at 6th grade.
Results:
A One-Way Analysis of Covariance (ANCOVA) was performed on social competence scores obtained at 8th grade to evaluate the treatment effect of the intervention program. The independent variable was the group status of control vs. treatment. Covariates were social competence and parent involvement scores measured at 6th grade prior to the intervention program. Analyses were conducted using SPSS version 13.
Outliers were examined using the definition that any standardized scores (the z scores) within each group less than or great than 3 were univariate outliers. Original sample of 2,000 was reduced to 1,957 with 43 participants excluded from the analysis as outliers.
Assumption evaluations indicated that the normality, homogeneity of variance, linearity and homogeneity of regression slopes assumptions were all satisfactory. Specifically, the assumption of homogeneity of regression slope was examined by testing the interaction effect of the independent variable and the covariate. The interaction term of social competence at 6th grade and the independent variable was not significant (p = 0.76). The interaction term of Parent Involvement and the independent variable was not significant either (p = 0.41). Therefore, the assumption of homogeneity of regression slopes was satisfied.
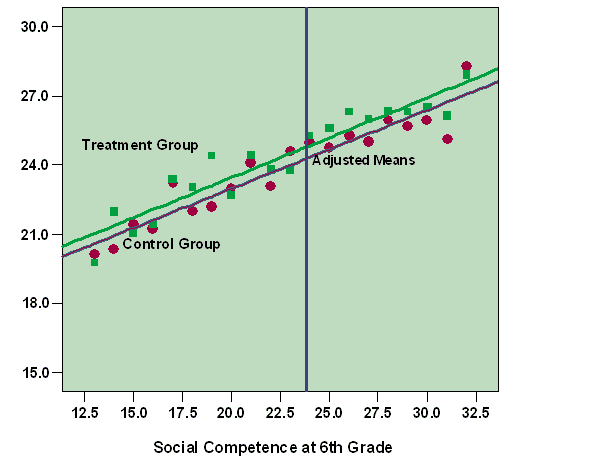
The assumption of homogeneity of regression slopes was also evaluated using Figure 1 which shows two regression lines for Control and Treatment groups, with the dependent variable (social competence at 8th grade) regressed on the covariate (social competence at 6th grade). It can be seen that the two regression lines are approximately parallel with exclusion of a few outliers, suggesting that the assumption of homogeneity of regression slopes is satisfactory. Figure 1 also shows the adjusted means of social competence for the two groups at the mean of the covariate (mean of social competence at 6th grade = 23.85).
Figure 1
Treatment Effect Showing Social Competence at 8th for Control and Treatment Groups with Social Competence at 6th Grade as a Covariate


|
Table 1 presents the findings from ANCOVA using the General Linear Modeling approach in SPSS. After adjustment by social competence and parent involvement as covariates, social competence at the end of 8th grade was significant with F (1, 1941) = 3.95, p < 0.05, indicating significant treatment effects (see Table 1). The adjusted and unadjusted means for the control and treatment groups were presented in Table 2. The treatment group had significantly higher social competence scores for adjusted mean relative to the control group, suggesting that the intervention program had significantly enhanced adolescent social competence skills during middle schools after adjustment in the covariates. The independent Sample t test on the social competence scores at 6th grade failed to show group difference with t (1955) = 1.01, p = 0.32 indicating that no significant difference at baseline.
Table 1
Analysis of Covariance of Evaluating Treatment Effect on Social Competence
| Source of Variance | Adjusted SS | df | MS | F |
| Parent Involvement | 137.8 | 1 | 137.8 | 5.52* |
| Social Comp. at 6th | 3701.9 | 1 | 3701.9 | 148.33** |
| Treatment | 98.6 | 1 | 98.6 | 3.95* |
| Error | 48441.8 | 1941 | 24.9 |
Table 2
Adjusted and Unadjusted Means of Social Competence Scores at 8th Grade for Treatment and Control Groups
| Group | Unadjusted Mean | Adjusted Mean | |
| 6th Grade | 8th Grade | ||
| Control (N = 1053) | 23.73 (4.72) | 24.35 (5.34) | 24.39 (0.16) |
| Treatment (N = 904) | 23.94 (4.81) | 24.90 (5.14) | 24.84 (0.17) |
Inter-correlations among covariates and the dependent variable are presented in Table 3. It can be seen that both covariates are correlated with the dependent variable, which indicate that the covariates meet the basic requirements in Analysis of Covariance.
Table 3 Correlations Among Two Covariates and the Dependent Variable
| 1 | 2 | 3 | |
| 1 Social Competence at 6th Grade | 1.00 | 0.35** | 0.30** |
| 2 Parent Involvement at 6th Grade | 1.00 | 0.15** | |
| 3 Social Competence at 8th Grade | 1.00 |
To download the source data, please click here.